|
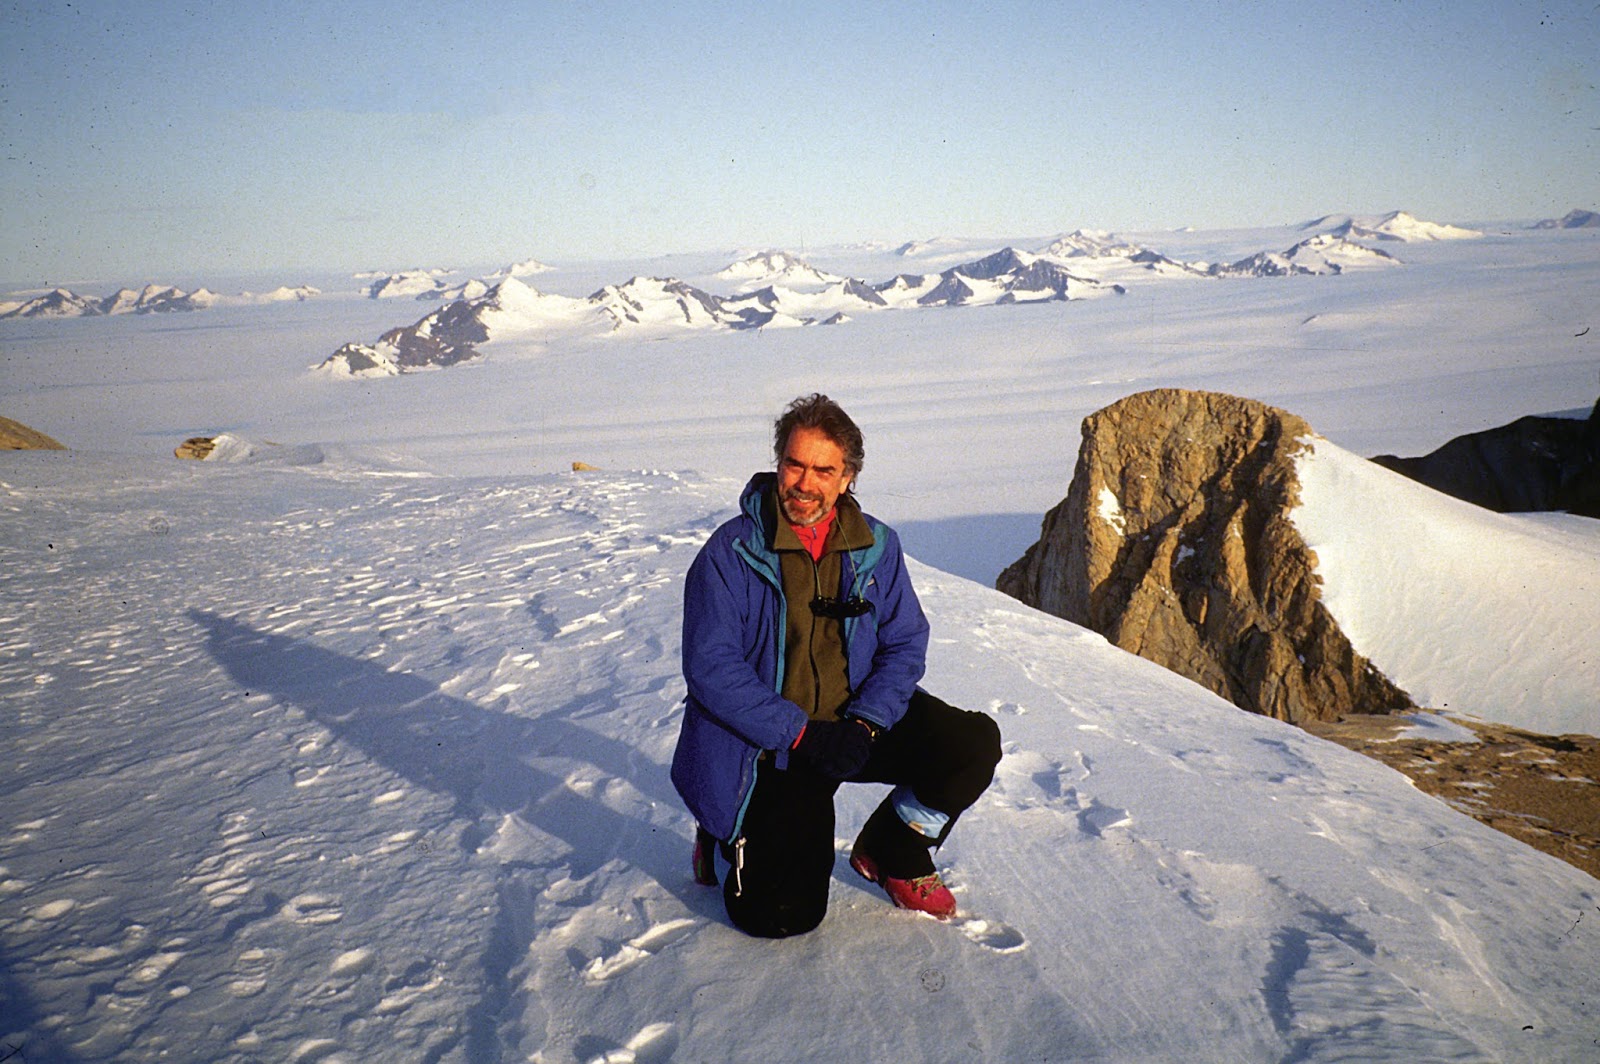
| Mount Minot, Northern Victoria Land. Photo © B. Luyendyk |
Global sea-level has been creeping upward over the past decades, now at a rate of about 3 mm/ year (1). This is largely due to warming of the world ocean (thermal expansion) and melting of ice now sitting on land. What about the future and what about California and sea-level rise?
Let’s do a thought experiment. Imagine you filled your bathtub at home with a generous amount of water, and you slide a block of ice into it. The water level goes up of course, and to the same level all around the tub.
Now take that thought experiment to the globe; add ice from West Antarctica, say 2 million gigatons to the world ocean (see West Antarctic Ice Sheet; WAIS; assuming 917 kilograms per cubic meter of ice).
The average rise in sea level would be around 14 feet (4.3 meters ref. 2).
The concern now is not the entire WAIS suddenly melting away but ice in the Amundsen Sea Embayment rapidly discharging into the sea in this century. This drainage, which includes the Pine Island Glacier (blog 10/6/17) and massive Thwaites Glacier, can contribute 4 feet of sea-level rise in a matter of decades (3). This is worrying.
But surprise! Sea-level won’t go up 4 feet everywhere. Sea-level isn’t level, it’s lumpy. Some places around the world it will rise more and some less. California is one of the places it will rise more. Why is this so?
The lumps and bumps in sea-level are affected by Earth’s rotation, ocean currents, and the distribution of mass on Earth’s surface and in its mantle. The massive amount of ice sitting atop Greenland and Antarctica draw sea-level upward due to gravitational attraction. Decrease that mass by melting and there is a counter-intuitive result; sea-level drops around Greenland and Antarctica. Where does that water go? It moves to lower latitudes. In fact, sea-level along the coast of California will rise 125% of the global average from melting of the West Antarctic Ice Sheet (4).
Of course, there’s another “but”. The paragraphs above talk about how global sea-level rise will vary from place to place, but we want to know how much it will rise where we live. Still more factors come into play to figure out changes in local sea level. This is the quest of the California Ocean Protection Council (COPC), who issued a report (5) this year seeking to answer that question. An obvious concern is whether a coastal location where you live is moving up or down on its own, regardless of sea-level rise. Effects that cause this vertical motion are tectonic uplift, particularly in northern California, sediment compaction along the coasts (sinking), and withdrawal of groundwater and/or hydrocarbons (also sinking). It’s the net effect of sea-level rise due to global scale effects and local effects just mentioned that determine the rate and amount of sea-level rise and its impact at any location.
The Council’s report considered historical records at three tide gauges along the California coast. At Crescent City, local sea-level has been dropping at around 0.8 mm/yr over 84 years, while global sea-level has been rising. Tectonic uplift predominates in northern California and is currently faster than sea-level rise. At San Francisco local sea-level has been rising at 1.84 mm/yr since 1855, and at San Diego, the average rate of rise is 2.13 mm/yr since 1906.
These rates in California over the past decades are linear on average—a straight line. There’s another “but”; projecting sea level rise in the global warming world reveals rise rates that accelerate. In fact, that is seen in data for the last few decades (6). The job of the COPC is to predict amounts of rise for the California coast under several different global warming scenarios.
They chose three different warming scenarios (greenhouse gas increases) as defined by the last IPCC report (ref. 7; AR5). Next, they used probability methods (8) to predict the chances of sea-level rise of a certain amount at these three places along the California coast. What did they find? The report gives the predictions at several levels of chance but I’ll present those for a 2-in-3 chance of a range of sea-level rise (ref 5; Table 1).
For starters, the COPC report states that the effects of climate change on sea-level start appearing in a dramatic way in mid-century. This is because the main effect of climate change on Antarctic ice melt now is a warming ocean but by mid-century, the main effect will be a warming atmosphere. That will drive faster melting. Here’s my distillation of Table 1 for the 2-in-3 chances (67%) and the IPCC mid-way warming estimate for the year 2100 (RCP 4.3).
Crescent City
Year 2030
|
0.0 – 0.3 ft
|
Year 2050
|
0.2 – 0.7 ft
|
Year 2100
|
0.3 – 2.7 ft
|
San Francisco
Year 2030
|
0.3 – 0.5 ft
|
Year 2050
|
0.6 – 1.1 ft
|
Year 2100
|
1.3 – 2.8 ft
|
La Jolla
Year 2030
|
0.4 – 0.6 ft
|
Year 2050
|
0.7 – 1.2 ft
|
Year 2100
|
1.3 – 2.8 ft
|
Added to these estimates of sea-level rise are the inevitable shorter-term events such as El Nino, storm surges, and King Tides.
Clearly, we need to pay attention and prepare.
The last “but” I want to introduce is the newly understood process of ice cliff collapse for Antarctic ice sheet retreat that I presented in my 1/8/17 blog. The COPC report also considers this as a possible sea-level rise impact on California. Not having enough data on this process to come up with a probability approach, the authors compute a model for sea level rise due to Antarctic ice sheet collapse without error limits. They call it the H++ model (9) based on research by DeConto and Pollard (10) and is considered a mean estimate for the consequence of the collapse of parts of the WAIS in the near future.
H++ scenario
Crescent City
Year 2100 = 9.3 ft
Year 2150 = 21 ft.
San Francisco
Year 2100 = 10 ft
Year 2150 = 22 ft
La Jolla
Year 2100 = 10 ft
Year 2150 = 22 ft
Where are we with this? For certain, it’s West Antarctica’s future that is the most serious challenge for California. The sea-level rise projections from Table 1 are limited to several feet this century. We can engineer for this – at considerable effort and expense, but it can be done. Once again, I conclude that West Antarctic ice stability is the wild card (blog 5/20/14). If it comes to pass that the WAIS begins collapsing by midcentury, we will see it. Then our response will be migration, not engineering. I won’t be migrating; my grandchildren will.
These projections are not based on fantasy and fake models. The geologic record not so long ago shows an analog for what we face. Geologic evidence from the Last Interglacial 125 thousand years ago, shows that with global temperatures similar to today sea-level was 20 to 30 feet higher (6 to 9 meters; ref. 11).
We cannot wait for the small uncertainties in these estimates to vanish. It is prudent to act now by mitigating against greenhouse gas emissions and adapting to the clear rise in sea-level that is rapid now but will only increase.
_________
1 J. A. Church et al., in Climate Change 2013: The Physical Science Basis. Contribution of Working Group I to the Fifth Assessment Report of the Intergovernmental Panel on Climate Change, T. F. Stocker, D. Qin, G.-K. Plattner, M. Tignor, S. K. Allen, J. Boschung, A. Nauels, Y. Xia, V. Bex, P. M. Midgley, Eds. (Cambridge Univ. Press, 2013).
2 Fretwell P, Pritchard HD, Vaughan DG, Bamber JL, Barrand NE, Bell R, et al. Bedmap2: improved ice bed, surface and thickness datasets for Antarctica. Cryosph. 2013; 7:375–393.
3 Mouginot J, Rignot E, Scheuchl B. Sustained increase in ice discharge from the Amundsen Sea Embayment, West Antarctica, from 1973 to 2013. Geophys Res Lett. 2014; 41:1576–1584.
4 Mitrovica JX, Gomez N, Morrow E, Hay C, Latychev K, Tamisiea ME. On the robustness of predictions of sea level fingerprints. Geophys J Int. 2011; 187:729–742.
5 Griggs, G, Árvai, J, Cayan, D, DeConto, R, Fox, J, Fricker, HA, Kopp, RE, Tebaldi, C, Whiteman, EA (California Ocean Protection Council Science Advisory Team Working Group). Rising Seas in California: An Update on Sea-Level Rise Science. California Ocean Science Trust, April 2017.
6 Hay C, Morrow ED, Kopp RE, Mitrovica JX. 2015. Probabilistic reanalysis of twentieth-century sea-level rise. Nature 517: 481-4).
7 IPCC. Climate Change 2014: Synthesis Report. Contribution of Working Groups I, II and III to the Fifth Assessment Report of the Intergovernmental Panel on Climate Change [Core Writing Team, R.K. Pachauri and L.A. Meyer (eds.)]. Geneva, Switzerland. 2014.
8 Kopp RE, Horton RM, Little CM, Mitrovica JX, Oppenheimer M, Rasmussen DJ, et al. Probabilistic 21st and 22nd-century sea-level projections at a global network of tide- gauge sites. Earth’s Future. 2014; 2:383–406)
9 Sweet, W.V., R.E. Kopp, C.P. Weaver, J. Obeysekera, R.M. Horton, E.R. Thieler and CZ. Global and Regional Sea Level Rise Scenarios for the United States. 2017.
10 DeConto RM, Pollard D. Contribution of Antarctica to past and future sea-level rise. Nature. 2016; 531:591–597.)
11 Dutton A, Carlson AE, Long AJ, Milne GA, Clark P, et al. 2015. Sea-level rise due to polar ice-sheet mass loss during past warm periods. Science 3491.)